
📘 Fundamental Analysis: Complete Beginner’s Guide (2026)

Introduction
Fundamental Analysis is one of the most important methods used by investors to evaluate the true value of a company before investing in its shares. Unlike Technical Analysis, which focuses on price charts and market trends, Fundamental Analysis examines a company’s financial performance, business model, management quality, industry position, and future growth potential.
Whether you are a beginner investor or an experienced market participant, understanding Fundamental Analysis can help you identify fundamentally strong companies for long-term wealth creation. In this comprehensive guide, you will learn financial statements, balance sheets, income statements, cash flow analysis, financial ratios, company valuation, and investment strategies used by successful investors.https://www.finlitxpert.com/finlitxpert-traderx-live-2026/
What is Fundamental Analysis?
Definition of Fundamental Analysis
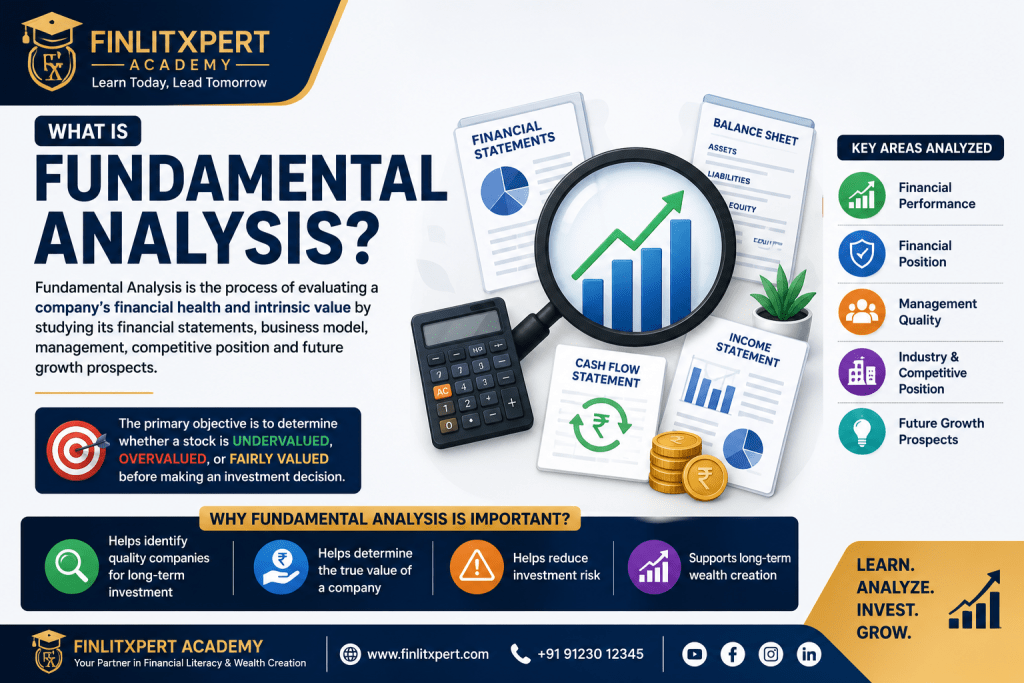
Fundamental Analysis is the process of evaluating a company’s financial health and intrinsic value by studying its financial statements, earnings, assets, liabilities, management quality, competitive position, and future growth prospects. The primary objective is to determine whether a stock is undervalued, overvalued, or fairly valued before making an investment decision.https://www.finlitxpert.com/
Objectives of Fundamental Analysis
The main objective of Fundamental Analysis is to identify quality companies capable of generating sustainable long-term returns. Investors use this approach to understand a company’s financial strength, profitability, business risks, competitive advantages, and future growth opportunities before investing.
Why is Fundamental Analysis Important?
Fundamental Analysis helps investors understand the true financial strength of a company before investing. Instead of making decisions based on rumors or short-term price movements, investors can evaluate a company’s revenue, profit, debt, cash flow, management quality, and future growth potential. This approach reduces investment risk and helps build a portfolio of fundamentally strong companies for long-term wealth creation.https://www.finlitxpert.com/
Benefits of Fundamental Analysis
Fundamental Analysis offers several advantages for long-term investors:
- Helps identify undervalued and overvalued stocks.
- Supports informed investment decisions using financial data.
- Reduces investment risk by evaluating business quality.
- Helps investors understand company growth potential.
- Builds confidence for long-term wealth creation.
- Prevents emotional investing based on market rumors.

Key Concepts of Fundamental Analysis
https://www.finlitxpert.com/finlitxpert-traderx-live-2026/
Fundamental Analysis is based on evaluating a company’s financial performance, business quality, and future growth potential. Investors study both quantitative data (financial numbers) and qualitative factors (management, industry, and competitive advantage) to determine the intrinsic value of a company’s shares.https://www.finlitxpert.com/
Intrinsic Value
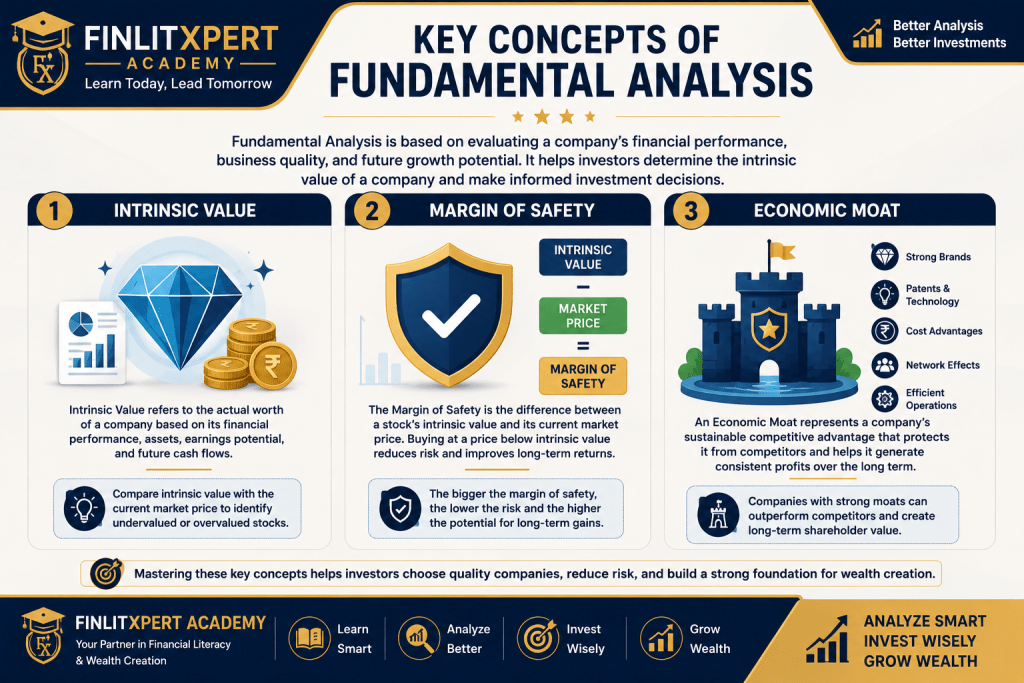
Intrinsic Value refers to the actual worth of a company based on its financial performance, assets, earnings potential, and future cash flows. Investors compare the intrinsic value with the current market price to identify whether a stock is undervalued or overvalued.
Margin of Safe
The Margin of Safety is the difference between a stock’s intrinsic value and its current market price. Buying quality companies at a price below their intrinsic value helps reduce investment risk and improves long-term returns.https://www.finlitxpert.com/
Economic Moathttps://www.finlitxpert.com/
An Economic Moat represents a company’s sustainable competitive advantage that protects it from competitors. Strong brands, patents, cost advantages, network effects, and efficient operations create a durable economic moat.https://www.finlitxpert.com/
Financial Statements Explained
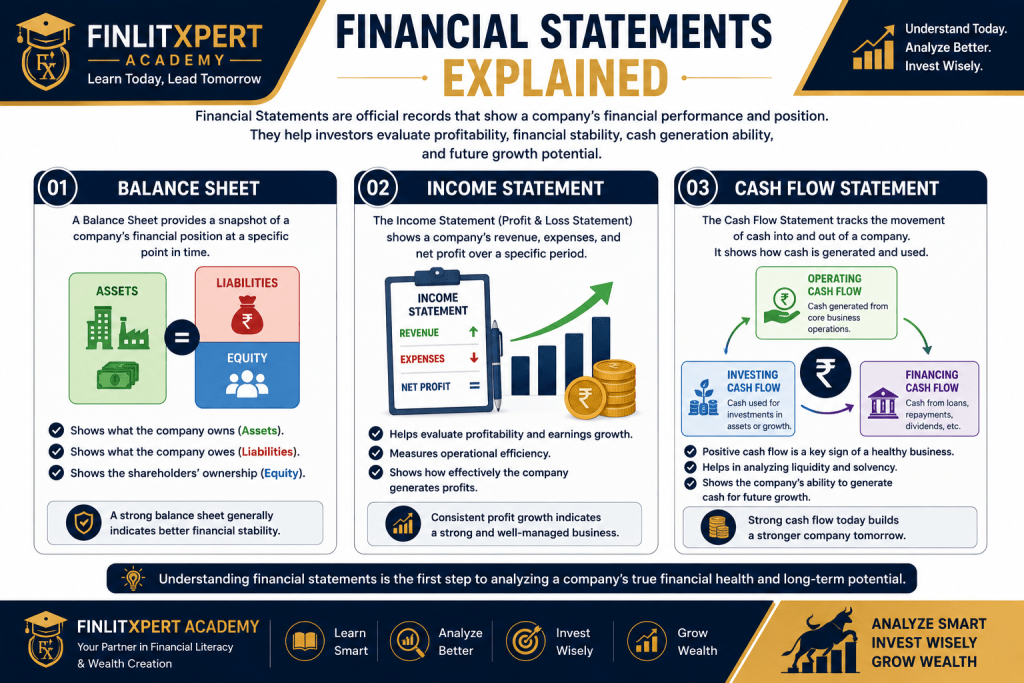
Financial Statements are official records that show a company’s financial performance and position. Investors use these reports to evaluate a company’s profitability, financial stability, cash generation ability, and future growth potential. The three primary financial statements are the Balance Sheet, Income Statement, and Cash Flow Statement.https://www.finlitxpert.com/
Balance Sheet
A Balance Sheet provides a snapshot of a company’s financial position at a specific point in time. It shows what the company owns (Assets), what it owes (Liabilities), and the shareholders’ Equity. A strong balance sheet generally indicates better financial stability.
Income Statement
The Income Statement, also known as the Profit and Loss Statement, shows a company’s revenue, expenses, and net profit over a specific period. Investors use it to evaluate profitability, earnings growth, and operational efficiency.https://www.finlitxpert.com/finlitxpert-traderx-live-2026/
Cash Flow Statement
The Cash Flow Statement tracks the movement of cash into and out of a company. It includes Operating Cash Flow, Investing Cash Flow, and Financing Cash Flow. Positive cash flow is a key indicator of a financially healthy business.
Balance Sheet Analysis
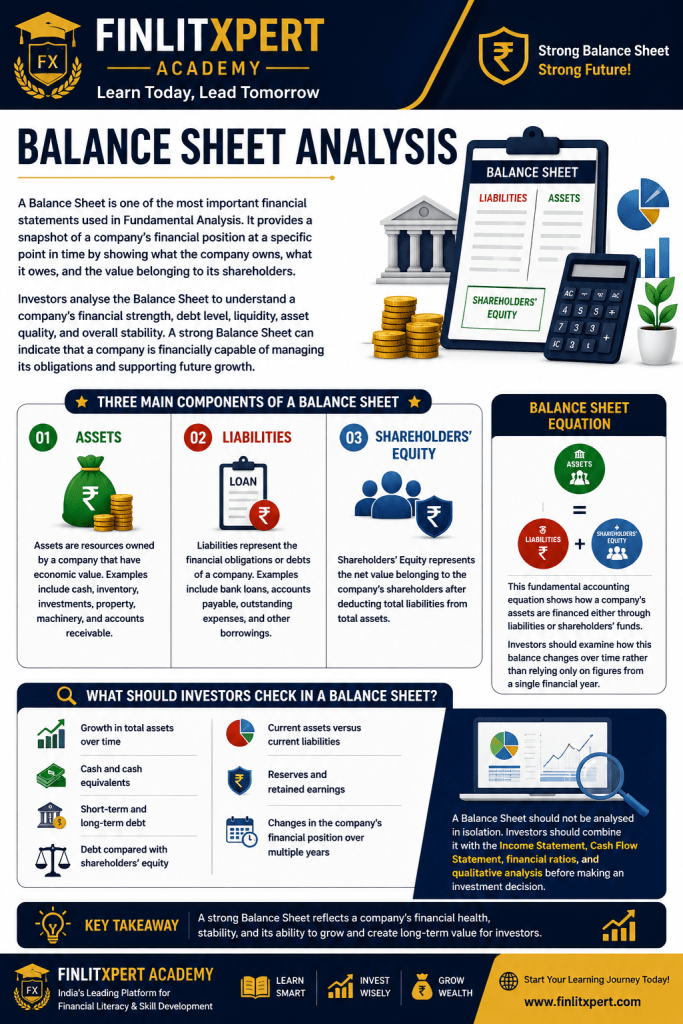
A Balance Sheet is one of the most important financial statements used in Fundamental Analysis. It provides a snapshot of a company’s financial position at a specific point in time by showing what the company owns, what it owes, and the value belonging to its shareholders.
Investors analyse the Balance Sheet to understand a company’s financial strength, debt level, liquidity, asset quality, and overall stability. A strong Balance Sheet can indicate that a company is financially capable of managing its obligations and supporting future growth.https://www.finlitxpert.com/
Three Main Components of a Balance Sheet
- Assets – Assets are resources owned by a company that have economic value. Examples include cash, inventory, investments, property, machinery, and accounts receivable.
- Liabilities – Liabilities represent the financial obligations or debts of a company. Examples include bank loans, accounts payable, outstanding expenses, and other borrowings.
- Shareholders’ Equity – Shareholders’ Equity represents the net value belonging to the company’s shareholders after deducting total liabilities from total assets.
What Should Investors Check in a Balance Sheet?
While analysing a Balance Sheet, investors should examine:
- Growth in total assets over time
- Cash and cash equivalents
- Short-term and long-term debt
- Debt compared with shareholders’ equity
- Current assets versus current liabilities
- Reserves and retained earnings
- Changes in the company’s financial position over multiple years
A Balance Sheet should not be analysed in isolation. Investors should combine it with the Income Statement, Cash Flow Statement, financial ratios, and qualitative analysis before making an investment decision.https://www.finlitxpert.com/finlitxpert-traderx-live-2026/
Income Statement Analysis
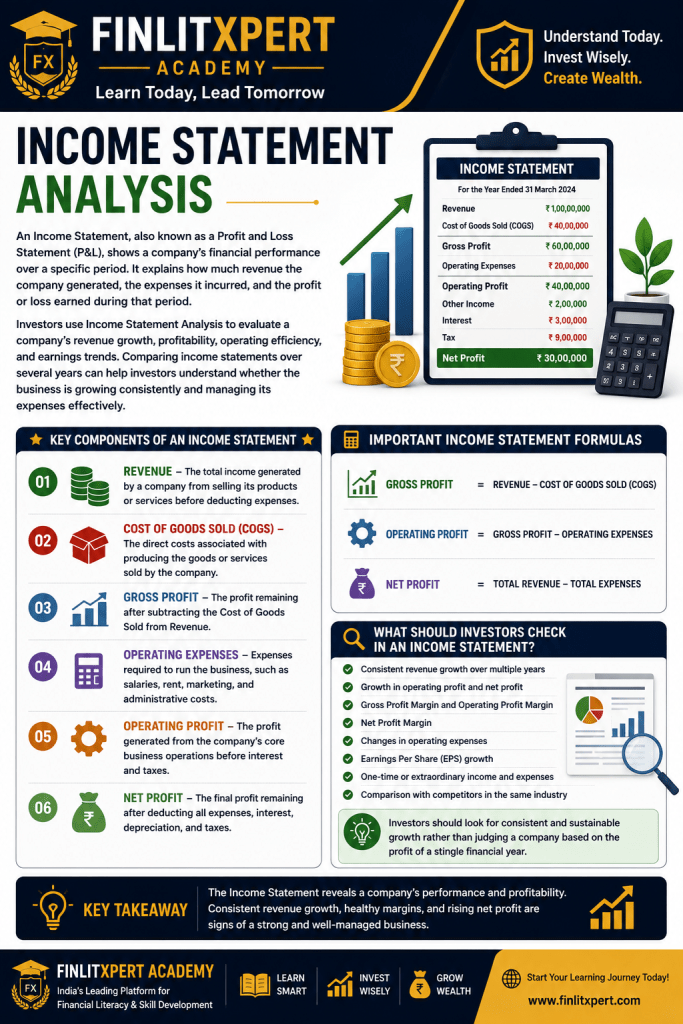
An Income Statement, also known as a Profit and Loss Statement (P&L), shows a company’s financial performance over a specific period. It explains how much revenue the company generated, the expenses it incurred, and the profit or loss earned during that period.https://www.finlitxpert.com/
Investors use Income Statement Analysis to evaluate a company’s revenue growth, profitability, operating efficiency, and earnings trends. Comparing income statements over several years can help investors understand whether the business is growing consistently and managing its expenses effectively.
Key Components of an Income Statement
- Revenue – The total income generated by a company from selling its products or services before deducting expenses.
- Cost of Goods Sold (COGS) – The direct costs associated with producing the goods or services sold by the company.
- Gross Profit – The profit remaining after subtracting the Cost of Goods Sold from Revenue.
- Operating Expenses – Expenses required to run the business, such as salaries, rent, marketing, and administrative costs.
- Operating Profit – The profit generated from the company’s core business operations before interest and taxes.
- Net Profit – The final profit remaining after deducting all expenses, interest, depreciation, and taxes.
- https://www.finlitxpert.com/finlitxpert-traderx-live-2026/
Important Income Statement Formulas
Gross Profit = Revenue – Cost of Goods Sold (COGS)
Operating Profit = Gross Profit – Operating Expenses
Net Profit = Total Revenue – Total Expenses
What Should Investors Check in an Income Statement?
While analysing an Income Statement, investors should examine:
- Consistent revenue growth over multiple years
- Growth in operating profit and net profit
- Gross Profit Margin and Operating Profit Margin
- Net Profit Margin
- Changes in operating expenses
- Earnings Per Share (EPS) growth
- One-time or extraordinary income and expenses
- Comparison with competitors in the same industry
Investors should look for consistent and sustainable growth rather than judging a company based on the profit of a single financial year.https://www.finlitxpert.com/
Cash Flow Statement
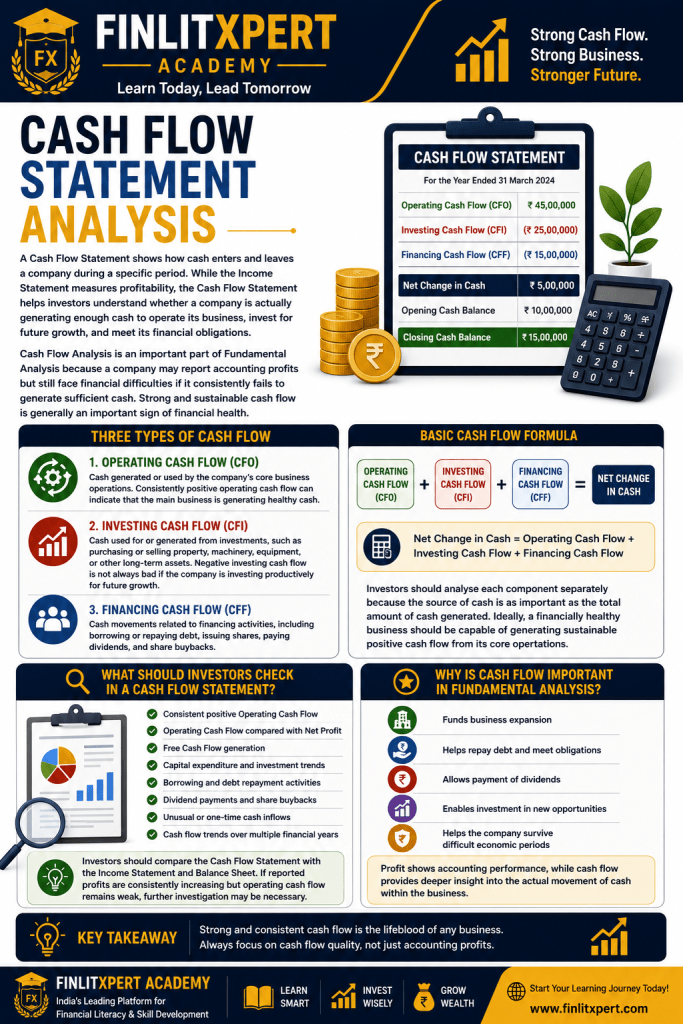
A Cash Flow Statement shows how cash enters and leaves a company during a specific period. While the Income Statement measures profitability, the Cash Flow Statement helps investors understand whether a company is actually generating enough cash to operate its business, invest for future growth, and meet its financial obligations.
Cash Flow Analysis is an important part of Fundamental Analysis because a company may report accounting profits but still face financial difficulties if it consistently fails to generate sufficient cash. Strong and sustainable cash flow is generally an important sign of financial health.
Three Types of Cash Flow
- Operating Cash Flow (CFO) – Cash generated or used by the company’s core business operations. Consistently positive operating cash flow can indicate that the main business is generating healthy cash.
- Investing Cash Flow (CFI) – Cash used for or generated from investments, such as purchasing or selling property, machinery, equipment, or other long-term assets. Negative investing cash flow is not always bad if the company is investing productively for future growth.
- Financing Cash Flow (CFF) – Cash movements related to financing activities, including borrowing or repaying debt, issuing shares, paying dividends, and share buybacks.https://www.finlitxpert.com/
Basic Cash Flow Formula
Net Change in Cash = Operating Cash Flow + Investing Cash Flow + Financing Cash Flow
Investors should analyse each component separately because the source of cash is as important as the total amount of cash generated. Ideally, a financially healthy business should be capable of generating sustainable positive cash flow from its core operations.
What Should Investors Check?
What Should Investors Check?
What Should Investors Check in a Cash Flow Statement?
While analysing a Cash Flow Statement, investors should examine:
- Consistent positive Operating Cash Flow
- Operating Cash Flow compared with Net Profit
- Free Cash Flow generation
- Capital expenditure and investment trends
- Borrowing and debt repayment activities
- Dividend payments and share buybacks
- Unusual or one-time cash inflows
- Cash flow trends over multiple financial years
Investors should compare the Cash Flow Statement with the Income Statement and Balance Sheet. If reported profits are consistently increasing but operating cash flow remains weak, further investigation may be necessary.
Important Financial Ratios
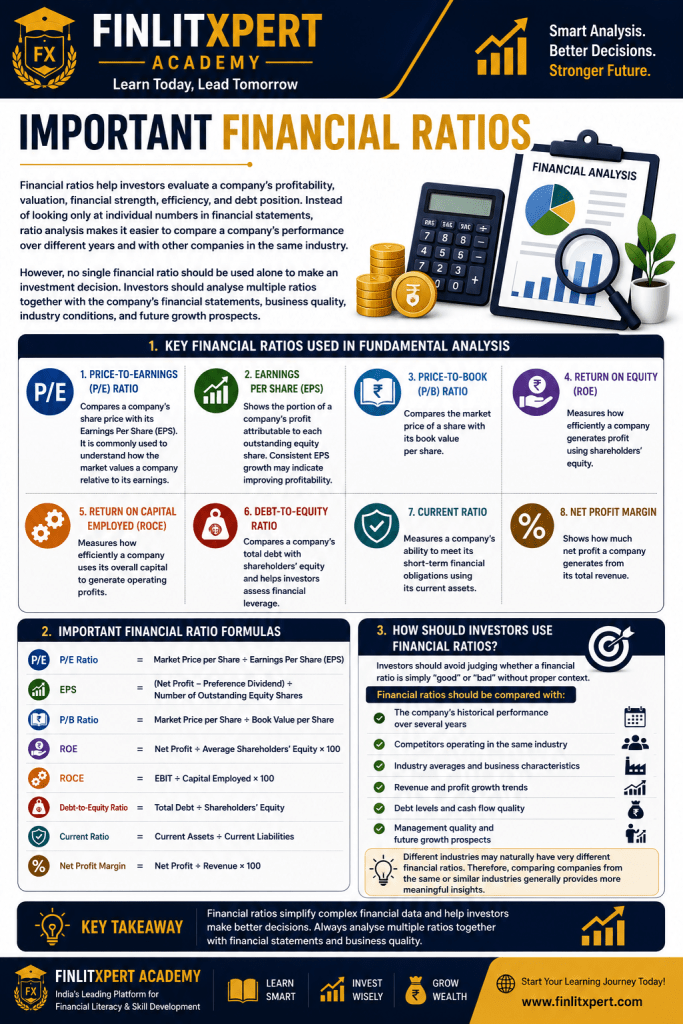
Financial ratios help investors evaluate a company’s profitability, valuation, financial strength, efficiency, and debt position. Instead of looking only at individual numbers in financial statements, ratio analysis makes it easier to compare a company’s performance over different years and with other companies in the same industry.
However, no single financial ratio should be used alone to make an investment decision. Investors should analyse multiple ratios together with the company’s financial statements, business quality, industry conditions, and future growth prospects.https://www.finlitxpert.com/
Key Financial Ratios Used in Fundamental Analysis
- Price-to-Earnings (P/E) Ratio – Compares a company’s share price with its Earnings Per Share (EPS). It is commonly used to understand how the market values a company relative to its earnings.
- Earnings Per Share (EPS) – Shows the portion of a company’s profit attributable to each outstanding equity share. Consistent EPS growth may indicate improving profitability.
- Price-to-Book (P/B) Ratio – Compares the market price of a share with its book value per share.
- Return on Equity (ROE) – Measures how efficiently a company generates profit using shareholders’ equity.
- Return on Capital Employed (ROCE) – Measures how efficiently a company uses its overall capital to generate operating profits.
- Debt-to-Equity Ratio – Compares a company’s total debt with shareholders’ equity and helps investors assess financial leverage.
- Current Ratio – Measures a company’s ability to meet its short-term financial obligations using its current assets.
- Net Profit Margin – Shows how much net profit a company generates from its total revenue.
Important Formulas
https://www.finlitxpert.com/finlitxpert-traderx-live-2026/
Important Financial Ratio Formulas
P/E Ratio = Market Price per Share ÷ Earnings Per Share (EPS)
EPS = (Net Profit – Preference Dividend) ÷ Number of Outstanding Equity Shares
P/B Ratio = Market Price per Share ÷ Book Value per Share
ROE = Net Profit ÷ Average Shareholders’ Equity × 100
ROCE = EBIT ÷ Capital Employed × 100
Debt-to-Equity Ratio = Total Debt ÷ Shareholders’ Equity
Current Ratio = Current Assets ÷ Current Liabilities
Net Profit Margin = Net Profit ÷ Revenue × 100
How Should Investors Use Financial Ratios?
How Should Investors Use Financial Ratios?
Investors should avoid judging whether a financial ratio is simply “good” or “bad” without proper context.
Financial ratios should be compared with:
- The company’s historical performance over several years
- Competitors operating in the same industry
- Industry averages and business characteristics
- Revenue and profit growth trends
- Debt levels and cash flow quality
- Management quality and future growth prospects
Different industries may naturally have very different financial ratios. Therefore, comparing companies from the same or similar industries generally provides more meaningful insights.https://www.finlitxpert.com/
https://www.finlitxpert.com/finlitxpert-traderx-live-2026/
Qualitative vs Quantitative Analysis
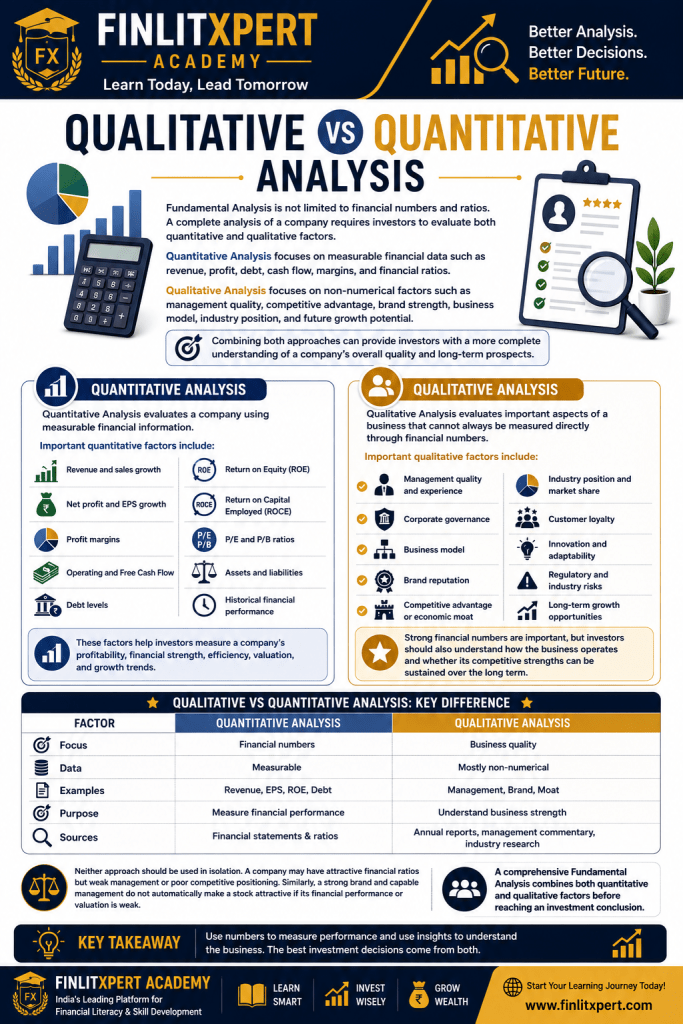
Fundamental Analysis is not limited to financial numbers and ratios. A complete analysis of a company requires investors to evaluate both quantitative and qualitative factors.
Quantitative Analysis focuses on measurable financial data such as revenue, profit, debt, cash flow, margins, and financial ratios. Qualitative Analysis focuses on non-numerical factors such as management quality, competitive advantage, brand strength, business model, industry position, and future growth potential.
Combining both approaches can provide investors with a more complete understanding of a company’s overall quality and long-term prospects.https://www.finlitxpert.com/
Quantitative Analysis
Quantitative Analysis
Quantitative Analysis evaluates a company using measurable financial information.
Important quantitative factors include:
- Revenue and sales growth
- Net profit and EPS growth
- Profit margins
- Operating and Free Cash Flow
- Debt levels
- Return on Equity (ROE)
- Return on Capital Employed (ROCE)
- P/E and P/B ratios
- Assets and liabilities
- Historical financial performance
These factors help investors measure a company’s profitability, financial strength, efficiency, valuation, and growth trends.https://www.finlitxpert.com/
Qualitative Analysis
Qualitative Analysis
Qualitative Analysis evaluates important aspects of a business that cannot always be measured directly through financial numbers.
Important qualitative factors include:
- Management quality and experience
- Corporate governance
- Business model
- Brand reputation
- Competitive advantage or economic moat
- Industry position and market share
- Customer loyalty
- Innovation and adaptability
- Regulatory and industry risks
- Long-term growth opportunities
Strong financial numbers are important, but investors should also understand how the business operates and whether its competitive strengths can be sustained over the long term.https://www.finlitxpert.com/finlitxpert-traderx-live-2026/
Key Difference
Qualitative vs Quantitative Analysis: Key Difference
| Factor | Quantitative Analysis | Qualitative Analysis |
|---|---|---|
| Focus | Financial numbers | Business quality |
| Data | Measurable | Mostly non-numerical |
| Examples | Revenue, EPS, ROE, Debt | Management, Brand, Moat |
| Purpose | Measure financial performance | Understand business strength |
| Sources | Financial statements & ratios | Annual reports, management commentary, industry research |
Neither approach should be used in isolation. A company may have attractive financial ratios but weak management or poor competitive positioning. Similarly, a strong brand and capable management do not automatically make a stock attractive if its financial performance or valuation is weak.
A comprehensive Fundamental Analysis combines both quantitative and qualitative factors before reaching an investment conclusion.https://www.finlitxpert.com/
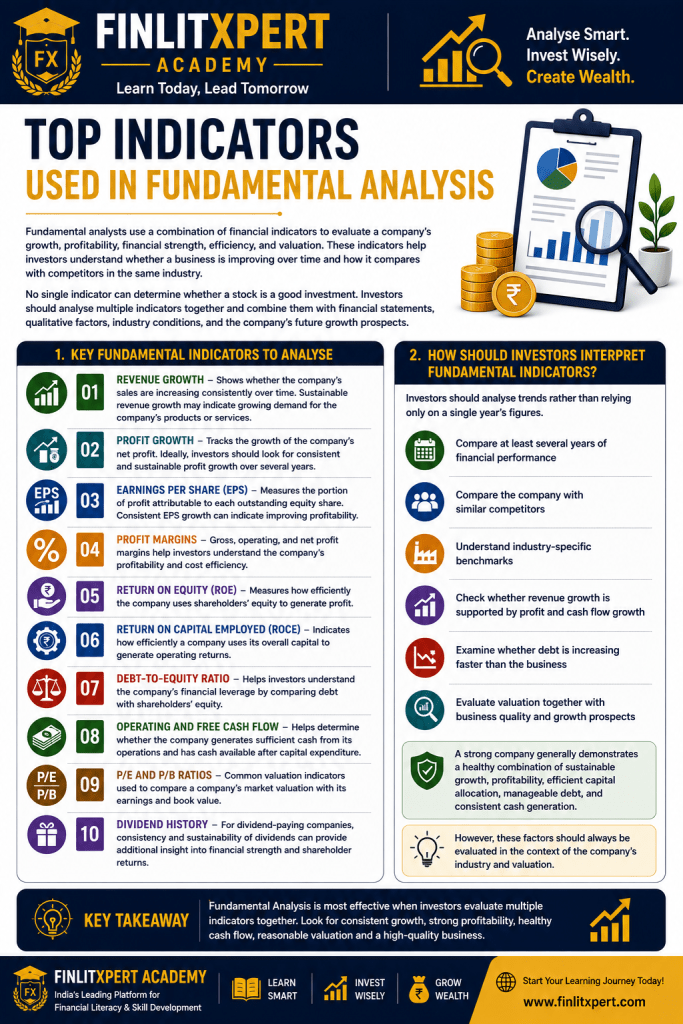
Top Indicators Used in Fundamental Analysishttps://www.finlitxpert.com/
Fundamental analysts use a combination of financial indicators to evaluate a company’s growth, profitability, financial strength, efficiency, and valuation. These indicators help investors understand whether a business is improving over time and how it compares with competitors in the same industry.
No single indicator can determine whether a stock is a good investment. Investors should analyse multiple indicators together and combine them with financial statements, qualitative factors, industry conditions, and the company’s future growth prospects.
Key Fundamental Indicators
Key Fundamental Indicators to Analysehttps://www.finlitxpert.com/
- Revenue Growth – Shows whether the company’s sales are increasing consistently over time. Sustainable revenue growth may indicate growing demand for the company’s products or services.
- Profit Growth – Tracks the growth of the company’s net profit. Ideally, investors should look for consistent and sustainable profit growth over several years.
- Earnings Per Share (EPS) – Measures the portion of profit attributable to each outstanding equity share. Consistent EPS growth can indicate improving profitability.
- Profit Margins – Gross, operating, and net profit margins help investors understand the company’s profitability and cost efficiency.
- Return on Equity (ROE) – Measures how efficiently the company uses shareholders’ equity to generate profit.
- Return on Capital Employed (ROCE) – Indicates how efficiently a company uses its overall capital to generate operating returns.
- Debt-to-Equity Ratio – Helps investors understand the company’s financial leverage by comparing debt with shareholders’ equity.
- Operating and Free Cash Flow – Helps determine whether the company generates sufficient cash from its operations and has cash available after capital expenditure.
- P/E and P/B Ratios – Common valuation indicators used to compare a company’s market valuation with its earnings and book value.
- Dividend History – For dividend-paying companies, consistency and sustainability of dividends can provide additional insight into financial strength and shareholder returns.
How to Interpret These Indicators
How Should Investors Interpret Fundamental Indicators?
Investors should analyse trends rather than relying only on a single year’s figures.
For better analysis:
- Compare at least several years of financial performance
- Compare the company with similar competitors
- Understand industry-specific benchmarks
- Check whether revenue growth is supported by profit and cash flow growth
- Examine whether debt is increasing faster than the business
- Evaluate valuation together with business quality and growth prospects
A strong company generally demonstrates a healthy combination of sustainable growth, profitability, efficient capital allocation, manageable debt, and consistent cash generation. However, these factors should always be evaluated in the context of the company’s industry and valuation.
Fundamental Analysis vs Technical Analysis
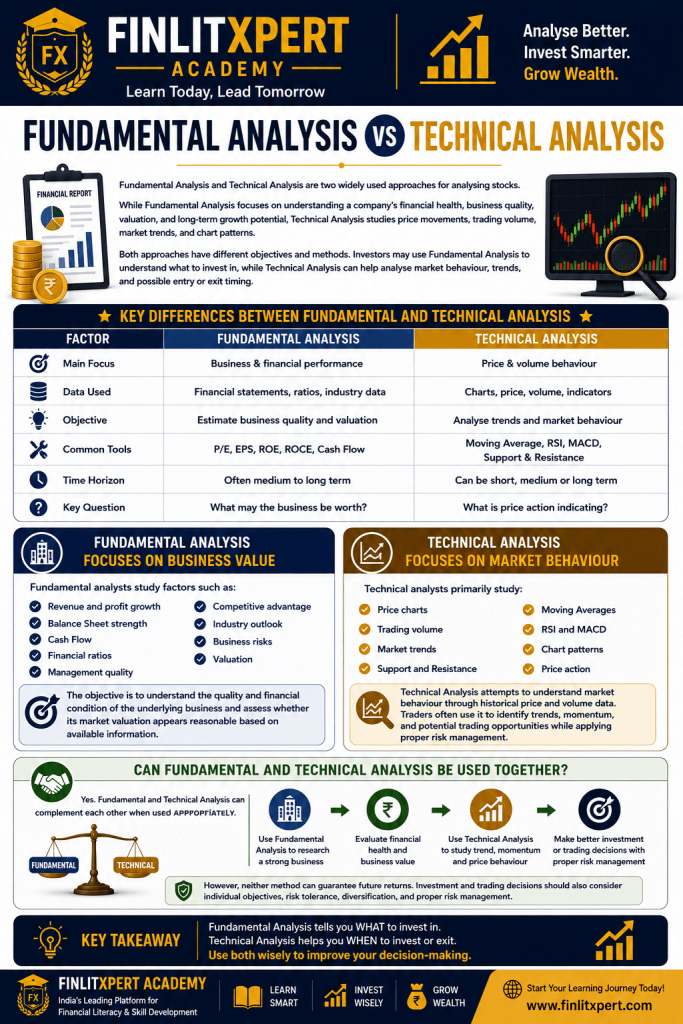
Fundamental Analysis and Technical Analysis are two widely used approaches for analysing stocks. While Fundamental Analysis focuses on understanding a company’s financial health, business quality, valuation, and long-term growth potential, Technical Analysis studies price movements, trading volume, market trends, and chart patterns.
Both approaches have different objectives and methods. Investors may use Fundamental Analysis to understand what to invest in, while Technical Analysis can help analyse market behaviour, trends, and possible entry or exit timing.https://www.finlitxpert.com/finlitxpert-traderx-live-2026/
Comparison Table
Key Differences Between Fundamental and Technical Analysis
| Factor | Fundamental Analysis | Technical Analysis |
|---|---|---|
| Main Focus | Business & financial performance | Price & volume behaviour |
| Data Used | Financial statements, ratios, industry data | Charts, price, volume, indicators |
| Objective | Estimate business quality and valuation | Analyse trends and market behaviour |
| Common Tools | P/E, EPS, ROE, ROCE, Cash Flow | Moving Average, RSI, MACD, Support & Resistance |
| Time Horizon | Often medium to long term | Can be short, medium or long term |
| Key Question | What may the business be worth? | What is price action indicating? |
Fundamental Analysis Focuses on Business Value
Fundamental Analysis Focuses on Business Value
Fundamental analysts study factors such as:
- Revenue and profit growth
- Balance Sheet strength
- Cash Flow
- Financial ratios
- Management quality
- Competitive advantage
- Industry outlook
- Business risks
- Valuation
The objective is to understand the quality and financial condition of the underlying business and assess whether its market valuation appears reasonable based on available information.https://www.finlitxpert.com/finlitxpert-traderx-live-2026/
Technical Analysis Focuses on Market Behaviour
Can Fundamental and Technical Analysis Be Used Together?
Yes. Fundamental and Technical Analysis can complement each other when used appropriately.
For example, an investor may use Fundamental Analysis to research a financially strong business and evaluate its valuation, while Technical Analysis may provide additional information about the stock’s current trend, momentum, and price behaviour.
However, neither method can guarantee future returns. Investment and trading decisions should also consider individual objectives, risk tolerance, diversification, and proper risk management.
Common Mistakes Beginners Mak
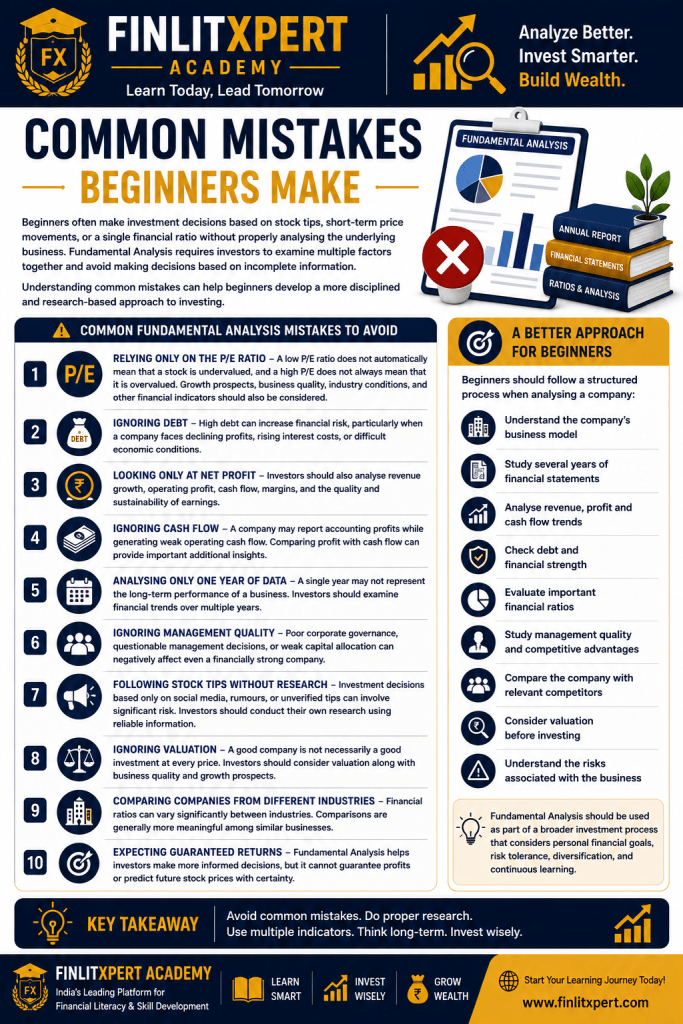
Beginners often make investment decisions based on stock tips, short-term price movements, or a single financial ratio without properly analysing the underlying business. Fundamental Analysis requires investors to examine multiple factors together and avoid making decisions based on incomplete information.
Understanding common mistakes can help beginners develop a more disciplined and research-based approach to investing.https://www.finlitxpert.com/
Common Fundamental Analysis Mistakes
Common Fundamental Analysis Mistakes to Avoid
- Relying Only on the P/E Ratio – A low P/E ratio does not automatically mean that a stock is undervalued, and a high P/E does not always mean that it is overvalued. Growth prospects, business quality, industry conditions, and other financial indicators should also be considered.
- Ignoring Debt – High debt can increase financial risk, particularly when a company faces declining profits, rising interest costs, or difficult economic conditions.
- Looking Only at Net Profit – Investors should also analyse revenue growth, operating profit, cash flow, margins, and the quality and sustainability of earnings.
- Ignoring Cash Flow – A company may report accounting profits while generating weak operating cash flow. Comparing profit with cash flow can provide important additional insights.
- Analysing Only One Year of Data – A single year may not represent the long-term performance of a business. Investors should examine financial trends over multiple years.
- Ignoring Management Quality – Poor corporate governance, questionable management decisions, or weak capital allocation can negatively affect even a financially strong company.
- Following Stock Tips Without Research – Investment decisions based only on social media, rumours, or unverified tips can involve significant risk. Investors should conduct their own research using reliable information.
- Ignoring Valuation – A good company is not necessarily a good investment at every price. Investors should consider valuation along with business quality and growth prospects.
- Comparing Companies from Different Industries – Financial ratios can vary significantly between industries. Comparisons are generally more meaningful among similar businesses.
- Expecting Guaranteed Returns – Fundamental Analysis helps investors make more informed decisions, but it cannot guarantee profits or predict future stock prices with certainty.https://www.finlitxpert.com/finlitxpert-traderx-live-2026/
A Better Approach for Beginners
A Better Approach for Beginners
Beginners should follow a structured process when analysing a company:
- Understand the company’s business model
- Study several years of financial statements
- Analyse revenue, profit and cash flow trends
- Check debt and financial strength
- Evaluate important financial ratios
- Study management quality and competitive advantages
- Compare the company with relevant competitors
- Consider valuation before investing
- Understand the risks associated with the business
Fundamental Analysis should be used as part of a broader investment process that considers personal financial goals, risk tolerance, diversification, and continuous learning.https://www.finlitxpert.com/finlitxpert-traderx-live-2026/
Best Practices for Beginners
Fundamental Analysis becomes more effective when investors follow a structured and disciplined approach. Beginners should focus on understanding the business first instead of making investment decisions only because a stock price is rising or because someone has recommended it.
Developing good research habits, analysing reliable information, and evaluating companies consistently can help beginners make more informed investment decisions over time.https://www.finlitxpert.com/
Fundamental Analysis Best Practices for Beginners
- Understand the Business First – Before analysing financial ratios, understand what the company does, how it earns revenue, who its customers are, and what factors drive its business.
- Study Multiple Years of Financial Data – Analyse several years of revenue, profit, EPS, debt, margins, and cash flow to identify long-term trends instead of relying on a single year.
- Read Financial Statements – Study the Balance Sheet, Income Statement, and Cash Flow Statement together to understand the company’s overall financial condition.
- Use Multiple Financial Ratios – Evaluate ratios such as P/E, P/B, ROE, ROCE, Debt-to-Equity, and profit margins together rather than relying on only one indicator.
- Compare with Relevant Competitors – Compare companies operating in the same or similar industries because financial ratios and business characteristics can vary significantly across sectors.
- Evaluate Management and Corporate Governance – Study management quality, capital allocation decisions, transparency, promoter-related information, and corporate governance practices.
- Analyse Cash Flow Carefully – Compare operating cash flow with reported profits and examine whether the company consistently generates sufficient cash from its core business.
- Consider Valuation – Even a high-quality company may not necessarily be attractive at every market price. Evaluate valuation in relation to growth prospects, business quality, risks, and relevant peers.
- Diversify and Manage Risk – Avoid concentrating all your investment capital in a single company or sector. Diversification can help manage company-specific and sector-specific risks.
- Keep Learning and Reviewing – Markets, businesses, industries, and economic conditions change over time. Continue learning and periodically review the assumptions behind your investments.https://www.finlitxpert.com/
A Simple Beginner Checklist
Simple Fundamental Analysis Checklist
Before considering an investment, ask:
✓ Do I understand the company’s business model?
✓ Are revenue and profits showing sustainable trends?
✓ Is operating cash flow healthy?
✓ Is the company’s debt manageable?
✓ Are ROE and ROCE reasonable compared with relevant peers?
✓ Does the company have competent management and sound corporate governance?
✓ Does the business have a sustainable competitive advantage?
✓ What are the major risks facing the company?
✓ How does the valuation compare with its growth prospects and relevant peers?
✓ Does this investment fit my financial goals and risk tolerance?
If you cannot answer these questions confidently, further research may be required before making an investment decision.https://www.finlitxpert.com/finlitxpert-traderx-live-2026/

Frequently Asked Questions (FAQ)
https://www.finlitxpert.com/finlitxpert-traderx-live-2026/
What is Fundamental Analysis?
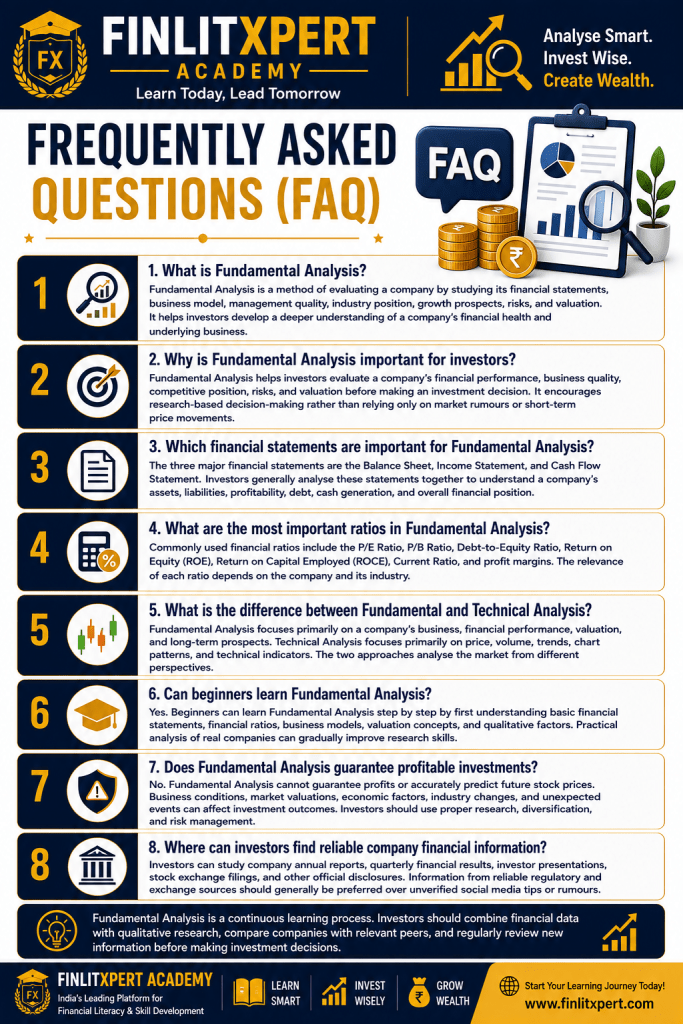
Fundamental Analysis is a method of evaluating a company by studying its financial statements, business model, management quality, industry position, growth prospects, risks, and valuation. It helps investors develop a deeper understanding of a company’s financial health and underlying business.
Why is Fundamental Analysis important for investors?
https://www.finlitxpert.com/finlitxpert-traderx-live-2026/
Fundamental Analysis helps investors evaluate a company’s financial performance, business quality, competitive position, risks, and valuation before making an investment decision. It encourages research-based decision-making rather than relying only on market rumours or short-term price movements.
Which financial statements are important for Fundamental Analysis?
The three major financial statements are the Balance Sheet, Income Statement, and Cash Flow Statement. Investors generally analyse these statements together to understand a company’s assets, liabilities, profitability, debt, cash generation, and overall financial position.https://www.finlitxpert.com/
What are the most important ratios in Fundamental Analysis?
Commonly used financial ratios include the P/E Ratio, P/B Ratio, Debt-to-Equity Ratio, Return on Equity (ROE), Return on Capital Employed (ROCE), Current Ratio, and profit margins. The relevance of each ratio depends on the company and its industry.https://www.finlitxpert.com/
What is the difference between Fundamental and Technical Analysis?
Fundamental Analysis focuses primarily on a company’s business, financial performance, valuation, and long-term prospects. Technical Analysis focuses primarily on price, volume, trends, chart patterns, and technical indicators. The two approaches analyse the market from different perspectives.https://www.finlitxpert.com/finlitxpert-traderx-live-2026/
Can beginners learn Fundamental Analysis?
Yes. Beginners can learn Fundamental Analysis step by step by first understanding basic financial statements, financial ratios, business models, valuation concepts, and qualitative factors. Practical analysis of real companies can gradually improve research skills.
Does Fundamental Analysis guarantee profitable investments?
No. Fundamental Analysis cannot guarantee profits or accurately predict future stock prices. Business conditions, market valuations, economic factors, industry changes, and unexpected events can affect investment outcomes. Investors should use proper research, diversification, and risk management.https://www.finlitxpert.com/finlitxpert-traderx-live-2026/
Where can investors find reliable company financial information?
Investors can study company annual reports, quarterly financial results, investor presentations, stock exchange filings, and other official disclosures. Information from reliable regulatory and exchange sources should generally be preferred over unverified social media tips or rumours.
Fundamental Analysis is a continuous learning process. Investors should combine financial data with qualitative research, compare companies with relevant peers, and regularly review new information before making investment decisions.https://www.finlitxpert.com/
Conclusion
Fundamental Analysis is a powerful approach for understanding the financial health, business quality, growth potential, risks, and valuation of a company. Instead of making investment decisions based only on short-term price movements or market rumours, it encourages investors to study the underlying business in a structured and disciplined manner.
A complete Fundamental Analysis involves studying the Balance Sheet, Income Statement, Cash Flow Statement, financial ratios, management quality, competitive advantages, industry conditions, and valuation. No single indicator should be used in isolation.
For beginners, the key is to start with the basics, analyse companies step by step, use reliable sources of information, and continue improving financial knowledge over time. Fundamental Analysis cannot guarantee investment returns, but it can help investors make more informed and research-based investment decisions.https://www.finlitxpert.com/
