Technical Analysis is one of the most popular methods used by traders to study financial markets and predict future price movements. Instead of focusing on a company’s financial statements, technical analysis examines price charts, trading volume, and historical market data to identify trends and trading opportunities.
Whether you are a beginner investor, day trader, or long-term market participant, learning technical analysis can help you make informed trading decisions. In this comprehensive guide, you will learn the basics of charts, candlestick patterns, indicators, support and resistance, trend analysis, and risk management.
What is Technical Analysis?
Definition of Technical Analysis
Technical Analysis is the study of historical price movements and trading volume to forecast future market behavior. It is based on the belief that all available information is already reflected in the market price. Traders use charts, indicators, and price patterns to identify buying and selling opportunities.
Technical Analysis helps traders identify market trends, entry and exit points, and potential price movements. It provides a structured approach to decision-making by analyzing historical price data rather than emotions. Whether trading stocks, commodities, forex, or cryptocurrencies, technical analysis improves discipline and risk management.
By learning technical analysis, beginners can better understand market psychology, recognize chart patterns, and use technical indicators to make more informed investment and trading decisions.
Who Should Learn Technical Analysis?
Technical Analysis is useful for beginners, swing traders, intraday traders, positional traders, investors, and anyone interested in financial markets. Even long-term investors use technical analysis to identify better buying and selling opportunities.
Basic Principles of Technical Analysis
Price Discounts Everything
Technical Analysis is based on the principle that all available information, including news, earnings, economic data, and market sentiment, is already reflected in the current market price.
Prices Move in Trends
Markets generally move in identifiable trends such as uptrend, downtrend, or sideways. Traders analyze these trends to determine the best time to enter or exit a trade.
Human emotions like fear and greed remain consistent over time. As a result, similar price patterns and market behaviors often repeat, allowing traders to identify future opportunities.
Market Psychology Matters
Technical Analysis reflects the psychology of buyers and sellers. Understanding market sentiment helps traders recognize potential reversals and continuation patterns.
Volume Confirms Price Movement
Trading volume helps confirm the strength of a price movement. A strong trend supported by high volume is generally considered more reliable than one with low trading volume.
Types of Charts
Line Chart
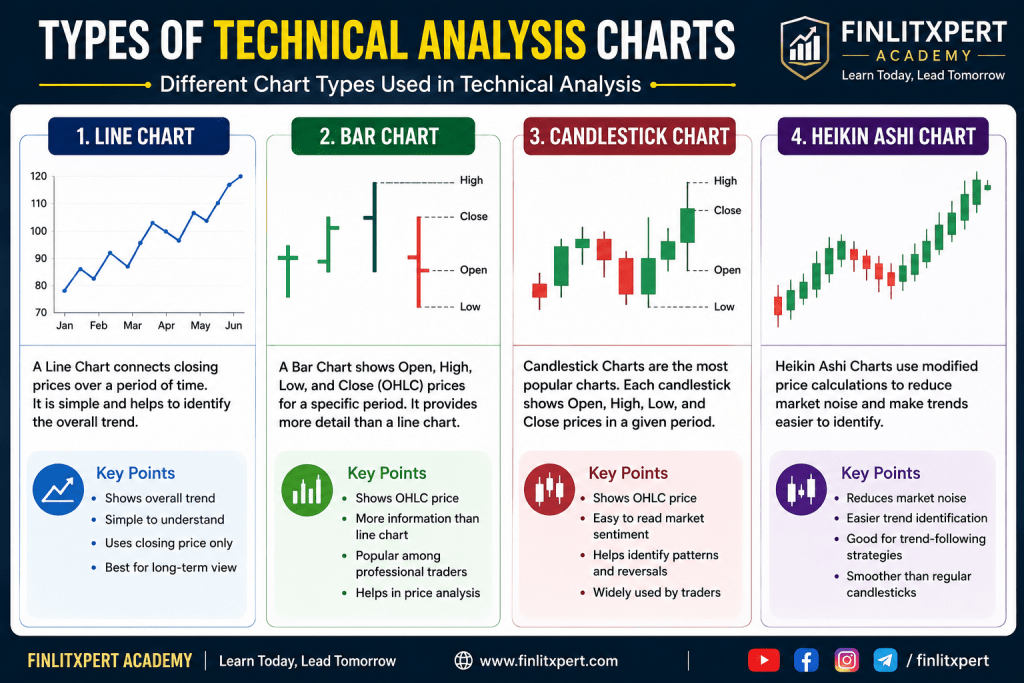
A Line Chart is the simplest type of price chart. It connects the closing prices of a stock over a specific period using a continuous line. It is useful for identifying the overall market trend but does not show detailed price movements.
Bar Chart
A Bar Chart displays the opening price, highest price, lowest price, and closing price (OHLC) for each trading session. It provides more detailed information than a line chart and is commonly used by professional traders.
Candlestick Chart
Candlestick Charts are the most widely used charts in technical analysis. Each candlestick represents the open, high, low, and close prices during a specific period. Candlestick patterns help traders understand market sentiment and predict potential trend reversals
Heikin Ashi Charts use modified price calculations to reduce market noise and make trends easier to identify. They are particularly useful for trend-following strategies and help traders stay in winning trades longer.
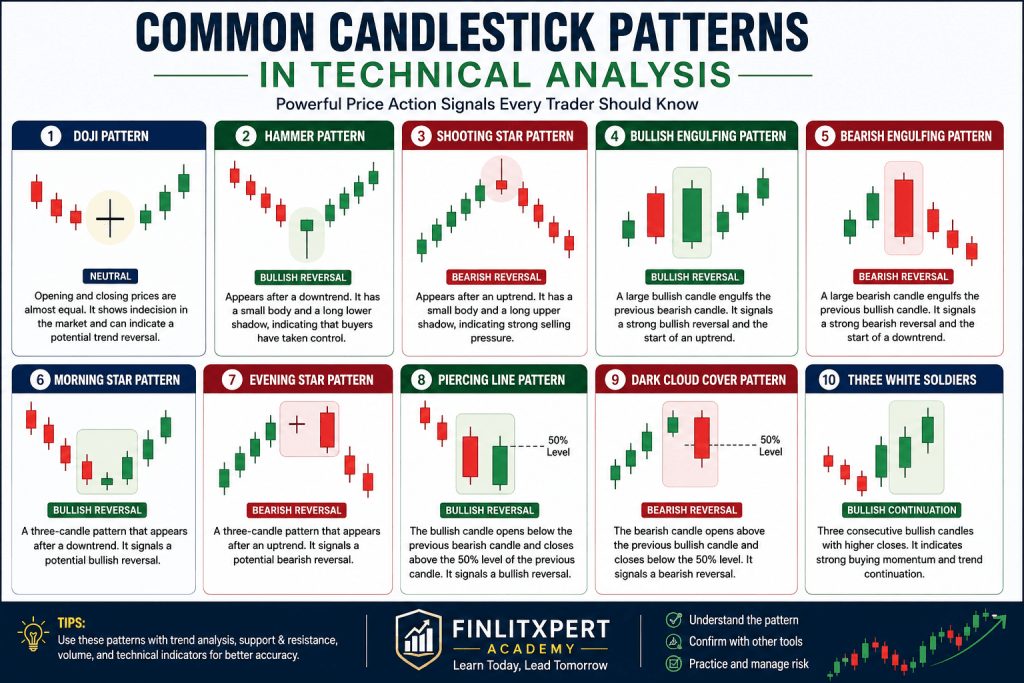
A Doji candlestick forms when the opening and closing prices are almost equal. It represents market indecision and may indicate a potential trend reversal depending on the surrounding price action.
Shooting Star Pattern
A Shooting Star forms after an uptrend and indicates a potential bearish reversal. It has a small body with a long upper shadow, suggesting strong selling pressure.
Bullish Engulfing Pattern
A Bullish Engulfing pattern occurs when a large bullish candle completely covers the previous bearish candle. It often signals the beginning of an upward trend.
A Bearish Engulfing pattern occurs when a large bearish candle completely engulfs the previous bullish candle. It is considered a strong bearish reversal signal.
Support and Resistance
What is Support?
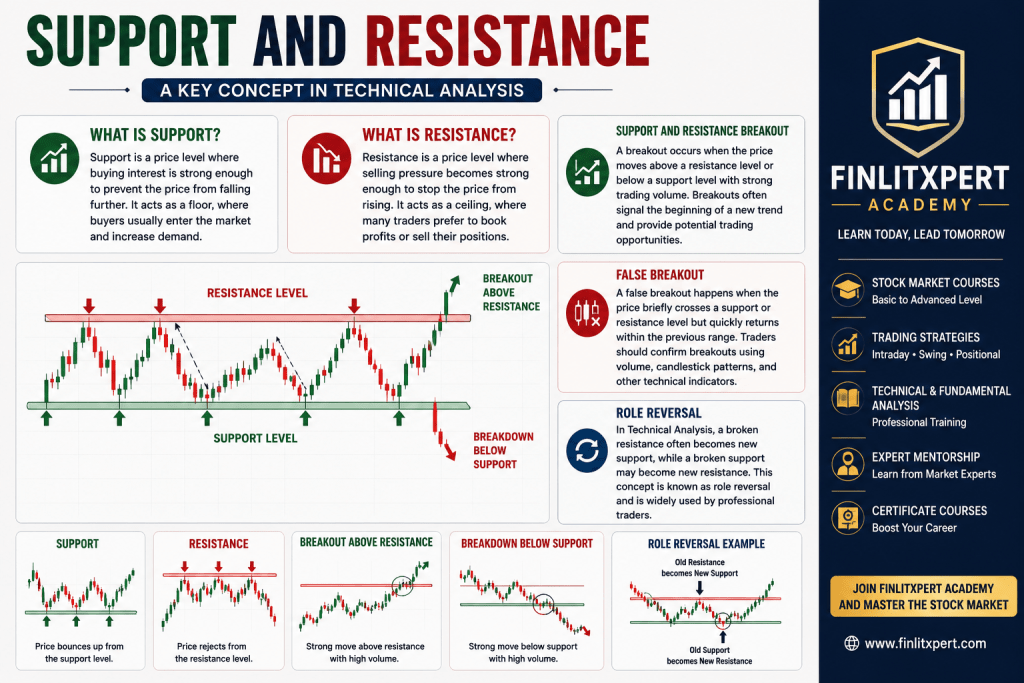
Support is a price level where buying interest is strong enough to prevent the price from falling further. It acts as a floor, where buyers usually enter the market and increase demand.
What is Resistance?
Resistance is a price level where selling pressure becomes strong enough to stop the price from rising. It acts as a ceiling, where many traders prefer to book profits or sell their positions.
Support and Resistance Breakout
A breakout occurs when the price moves above a resistance level or below a support level with strong trading volume. Breakouts often signal the beginning of a new trend and provide potential trading opportunities.
False Breakout
A false breakout happens when the price briefly crosses a support or resistance level but quickly returns within the previous range. Traders should confirm breakouts using volume, candlestick patterns, and other technical indicators.
In Technical Analysis, a broken resistance often becomes new support, while a broken support may become new resistance. This concept is known as role reversal and is widely used by professional traders.
Trend Analysis is the process of identifying the overall direction of a stock’s price movement over a specific period. It is one of the most important concepts in Technical Analysis because it helps traders understand whether the market is moving upward, downward, or sideways. Instead of predicting the future, trend analysis focuses on following the current market direction. Most successful traders follow the famous principle, “The Trend is Your Friend.” By trading in the direction of the prevailing trend, traders can improve their probability of making profitable trades while reducing unnecessary risks.
Uptrend (Bullish Trend)
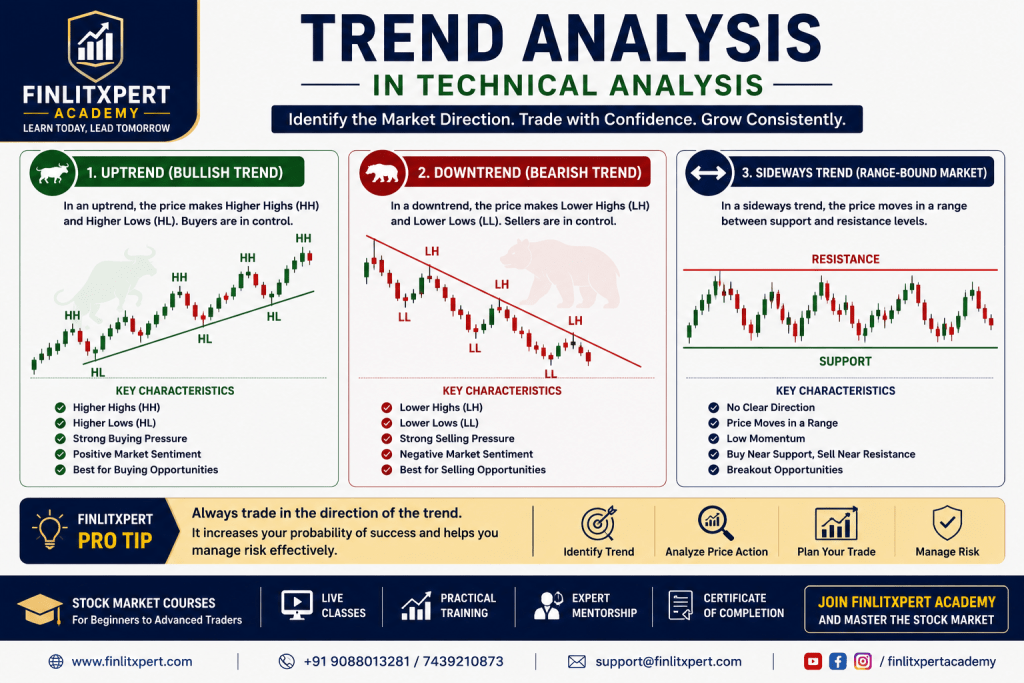
An Uptrend occurs when a stock consistently makes Higher Highs (HH) and Higher Lows (HL). This indicates strong buying pressure and positive market sentiment. During an uptrend, buyers dominate sellers, causing prices to rise steadily. Traders generally look for buying opportunities during this phase.
Downtrend (Bearish Trend)
A Downtrend occurs when a stock continuously forms Lower Highs (LH) and Lower Lows (LL). This indicates that sellers are stronger than buyers. Most traders avoid long positions during a downtrend and instead wait for a reversal or use short-selling strategies where permitted.
Sideways Trend (Range-Bound Market)
A Sideways Trend occurs when prices move within a fixed range without making significant higher highs or lower lows. During this phase, neither buyers nor sellers have complete control of the market. Traders usually buy near support levels and sell near resistance levels until a breakout occurs.
How to Identify a Trend
Traders use several techniques to identify trends accurately, including:
Trendlines
Moving Averages (20 EMA, 50 EMA, 200 EMA)
Support and Resistance Levels
Price Action Analysis
Volume Confirmation
Swing Highs and Swing Lows
Using multiple tools together increases the reliability of trend identification.
Professional traders always identify the trend before entering any trade.
📌 FINLITXPERT Pro Tip
Never trade against the primary trend. Trading with the trend significantly improves the probability of successful trades and helps manage risk more effectively.
Understanding Uptrend, Downtrend and Sideways Trend in Technical Analysis. Source: FINLITXPERT Academy.
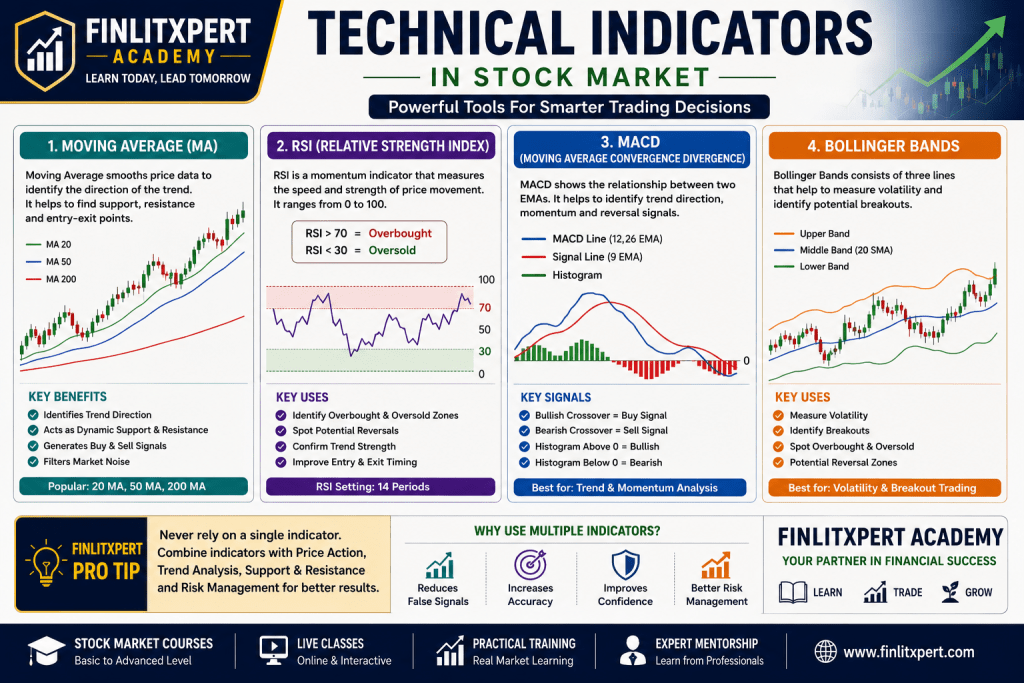
Technical Indicators are mathematical calculations based on a stock’s price, volume, or open interest. They help traders analyze market trends, identify potential entry and exit points, and make informed trading decisions. Indicators should always be used along with price action and risk management rather than as standalone trading signals. Professional traders combine multiple indicators to improve the accuracy of their analysis.
Moving Average (MA)
Moving Average is one of the most widely used trend-following indicators. It smooths price fluctuations and helps identify the overall market direction. Common Moving Averages include the 20-day, 50-day, and 200-day Moving Average.
Key Benefits:
Identifies market trend
Dynamic support and resistance
Generates buy and sell signals
Filters market noise
Relative Strength Index (RSI)
The Relative Strength Index (RSI) is a momentum indicator that measures the speed and strength of price movements. It ranges from 0 to 100.
RSI above 70 indicates an Overbought condition.
RSI below 30 indicates an Oversold condition.
Traders use RSI to identify possible reversal opportunities.
MACD (Moving Average Convergence Divergence)
MACD is a trend-following momentum indicator that shows the relationship between two exponential moving averages (EMAs). It consists of:
MACD Line
Signal Line
Histogram
A bullish crossover may indicate a buying opportunity, while a bearish crossover may indicate a selling opportunity.
Bollinger Bands
Bollinger Bands consist of three lines:
Upper Band
Middle Band (20 SMA)
Lower Band
These bands expand during high volatility and contract during low volatility. Traders use Bollinger Bands to identify breakouts, volatility, and possible reversal zones.
Why Use Multiple Indicators?
Using multiple indicators together improves trading accuracy. For example:
Moving Average + RSI
MACD + Volume
Bollinger Bands + Price Action
Combining indicators helps reduce false signals and increases confidence in trading decisions.
Never rely on a single indicator. Combine Technical Indicators with Price Action, Trend Analysis, Support & Resistance, and proper Risk Management for better trading decisions.
The four most popular Technical Indicators used by traders: Moving Average, RSI, MACD and Bollinger Bands.
Volume Analysis
Volume Analysis is an essential part of Technical Analysis that measures the number of shares traded during a specific period. It helps traders understand the strength behind a price movement. A price move supported by high trading volume is generally considered more reliable than one with low volume. By combining volume with price action, traders can confirm trends, identify breakouts, and avoid false trading signals.
What is Volume?
Volume represents the total number of shares or contracts traded within a given time frame. Higher trading volume indicates greater market participation and liquidity, while lower volume may suggest weak interest in the stock.
Price and Volume Relationship
The relationship between price and volume provides valuable trading insights.
Rising Price + Rising Volume = Strong Bullish Signal
Falling Price + Rising Volume = Strong Bearish Signal
Rising Price + Falling Volume = Weak Uptrend
Falling Price + Falling Volume = Weak Downtrend
Traders use this relationship to confirm whether a trend is likely to continue or reverse.
High Volume Breakout
A breakout above a resistance level with significantly higher trading volume often indicates strong buying interest. Such breakouts have a higher probability of continuing in the direction of the breakout.
Key Points:
Confirms breakout strength
Indicates institutional participation
Higher probability of trend continuation
Low Volume Trap
When a stock breaks above resistance with very low trading volume, the breakout may fail. These are known as False Breakouts or Low Volume Traps.
Warning Signs:
Weak buying interest
Low market participation
Higher chance of reversal
Why Volume Analysis Matters
Volume Analysis helps traders:
Confirm market trends
Validate breakout and breakdown signals
Identify accumulation and distribution phases
Improve entry and exit timing
Reduce false trading signals
Professional traders always analyze volume before entering a trade.
Price tells you what is happening, but Volume tells you how strong the move is. Always confirm price action with volume before making any trading decision.
Stock Market Volume Analysis showing Price and Volume Relationship High Volume Breakout and Low Volume Trap | FINLITXPERT Academy
Risk Management in Technical Analysis
Risk Management is one of the most important aspects of successful trading. Even the best trading strategy cannot guarantee 100% winning trades. Effective risk management helps traders protect their capital, minimize losses, and achieve consistent long-term growth. Professional traders focus more on managing risk than predicting market movements.https://www.finlitxpert.com/
Stop Loss
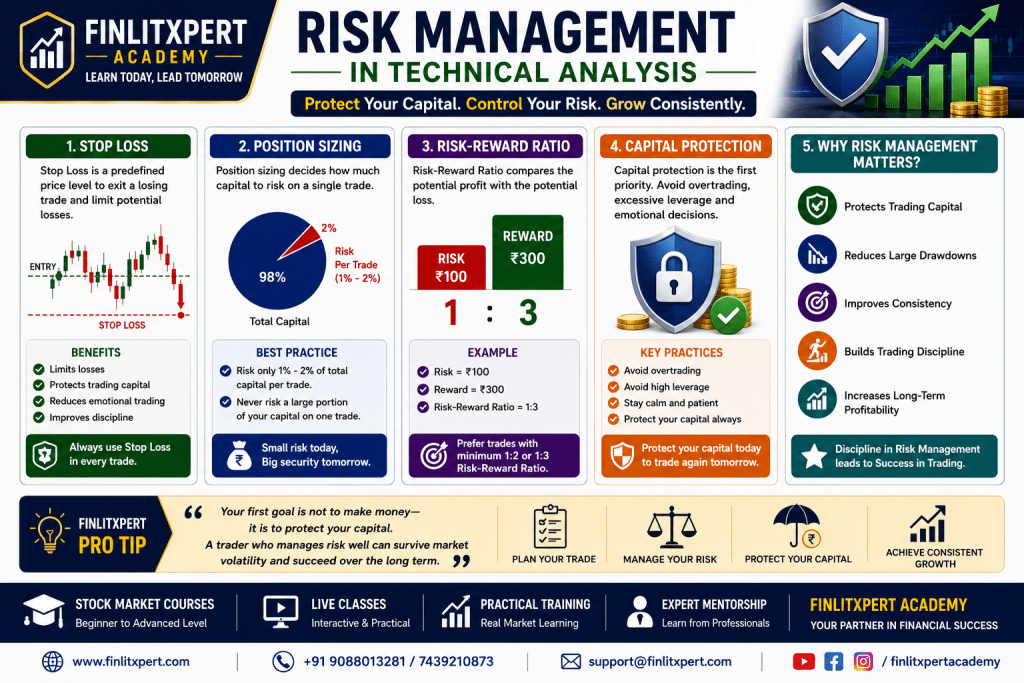
A Stop Loss is a predefined price level at which a trader exits a losing trade automatically. It helps limit potential losses and prevents emotional decision-making.
Benefits:
Limits losses
Protects trading capital
Reduces emotional trading
Improves discipline
Position Sizing
Position sizing refers to deciding how much capital to invest in a single trade. Traders should avoid risking a large percentage of their trading capital on one position.
Best Practice:
Risk only 1%–2% of total capital per trade.
Diversify investments across different stocks or sectors.
Risk-Reward Ratio
The Risk-Reward Ratio compares the potential profit of a trade with the potential loss.
Example:
Risk = ₹100
Reward = ₹300
Risk-Reward Ratio = 1:3
Professional traders generally prefer trades with a minimum 1:2 or 1:3 risk-reward ratio.
Capital Protection
Capital preservation is the first priority of every successful trader. Avoid overtrading, excessive leverage, and emotional decisions. Protecting your capital ensures that you stay in the market long enough to benefit from future opportunities.
Your first goal is not to make money—it is to protect your capital. A trader who manages risk well can survive market volatility and succeed over the long term.
Learn how Stop Loss, Position Sizing, Risk-Reward Ratio and Capital Protection help traders manage risk effectively.
Common Mistakes Beginners Make
Many beginners make common mistakes that reduce their chances of success in the stock market. Avoiding these mistakes can significantly improve trading performance.
. Trading Without a Plan
Entering trades without predefined entry, target and stop-loss levels often leads to emotional decisions.
2. Ignoring Risk Management
Risking a large portion of capital on a single trade can result in heavy losses.
3. Overtrading
Taking too many trades without proper analysis increases transaction costs and reduces discipline.
4. Depending on One Indicator
No indicator is 100% accurate. Always combine multiple indicators with price action.
5. Ignoring Market Trend
Trading against the overall trend usually has a lower probability of success.
6. Emotional Trading
Fear and greed are the biggest enemies of successful traders.
7. No Trading Journal
Maintaining a trading journal helps identify mistakes and improve strategies.
Key Takeaway
Successful Technical Analysis is not about predicting every market move. It is about following a disciplined process while managing risk effectively.
Avoid these common Technical Analysis mistakes to become a disciplined and profitable trader.
Both Technical Analysis and Fundamental Analysis are widely used methods for evaluating stocks. While Technical Analysis focuses on price movements and market trends, Fundamental Analysis evaluates a company’s financial health and intrinsic value. Understanding the differences between these two approaches helps investors choose the right strategy based on their goals.
Technical Analysis
Technical Analysis studies historical price movements, chart patterns, trading volume and technical indicators. Traders use this method to identify entry and exit points and predict short-term market movements.
Key Features:
Focuses on price and volume. Uses charts and technical indicators. Best for short-term trading. Helps identify market trends. Suitable for Intraday and Swing Trading.
Fundamental Analysis
Fundamental Analysis evaluates a company’s financial statements, earnings, assets, liabilities, management quality and industry performance. Investors use it to determine whether a stock is undervalued or overvalued.
Key Features:
Focuses on company fundamentals.
Uses financial reports and ratios.
Best for long-term investing.
Measures intrinsic value.
Suitable for wealth creation.
Major Differences
Technical Analysis
Fundamental Analysis
Studies Price Charts
Studies Financial Statements
Short-term Trading
Long-term Investing
Uses Indicators
Uses Financial Ratios
Identifies Entry & Exit Points
Identifies Business Value
Market Psychology
Company Performance
Which One is Better?
Neither method is universally better. Technical Analysis is ideal for traders looking for short-term opportunities, while Fundamental Analysis is better suited for long-term investors.
Professional investors often combine both approaches. Fundamental Analysis helps identify quality companies, while Technical Analysis helps determine the best time to buy or sell.
For the best investment decisions, combine Fundamental Analysis to select strong businesses and Technical Analysis to optimize entry and exit timing. This balanced approach improves both accuracy and risk management.
Compare Technical Analysis and Fundamental Analysis to choose the right investment strategy.
Success in Technical Analysis comes from consistency, discipline and continuous learning. Following proven best practices helps traders improve decision-making while reducing unnecessary risks.
1. Learn the Basics First
Before risking real money, understand chart patterns, candlestick formations, trend analysis, support & resistance and technical indicators.
2. Practice on a Demo Account
Use a demo trading account to test strategies and build confidence without risking capital.
3. Follow the Trend
“Trend is your friend.” Trading with the overall market trend generally provides higher probability setups than trading against it.
4. Always Use Stop-Loss
Protect your capital by placing a stop-loss order on every trade. Never allow one trade to damage your trading account.
5. Manage Risk Properly
Professional traders rarely risk more than 1%–2% of their trading capital on a single trade.
6. Keep a Trading Journal
Record every trade, including entry price, exit price, stop-loss, target, and the reason for taking the trade. Reviewing past trades helps improve future performance.
7. Continue Learning
Financial markets constantly evolve. Keep learning new strategies, indicators, market psychology and risk management techniques.
FINLITXPERT Pro Tip
Successful traders focus on discipline, patience and consistency rather than trying to win every trade. Long-term success comes from following a well-defined trading plan.
Follow these best practices to improve your Technical Analysis skills and become a disciplined trader.
Frequently Asked Questions (FAQ)
1. What is Technical Analysis?
Technical Analysis is the process of analyzing historical price movements, trading volume and chart patterns to predict future market trends and identify trading opportunities.
Yes. Technical Analysis helps beginners understand market trends, identify entry and exit points, and manage trading risk more effectively.
3. Which is better: Technical Analysis or Fundamental Analysis?
Both methods serve different purposes. Technical Analysis is ideal for short-term trading, while Fundamental Analysis is better for long-term investing. Many successful investors use both together.
4. What are the best Technical Indicators?
Some of the most popular indicators include:
Moving Average (MA)
Relative Strength Index (RSI)
MACD
Bollinger Bands
Volume Indicator
5. Can Technical Analysis predict the market accurately?
No. Technical Analysis improves the probability of making better trading decisions but cannot guarantee future market movements.
6. Is Technical Analysis enough for stock investing?
For short-term trading, Technical Analysis is very useful. For long-term investing, combining Technical Analysis with Fundamental Analysis provides better results.
7. How long does it take to learn Technical Analysis?
The basics can be learned within a few weeks, but mastering Technical Analysis requires continuous practice, discipline, and real market experience.
8. Where can I learn Technical Analysis professionally?
You can learn Technical Analysis through structured training programs, live market sessions, and practical workshops offered by FINLITXPERT Academy, where beginners and traders receive step-by-step guidance.
Frequently Asked Questions about Technical Analysis for Beginners.
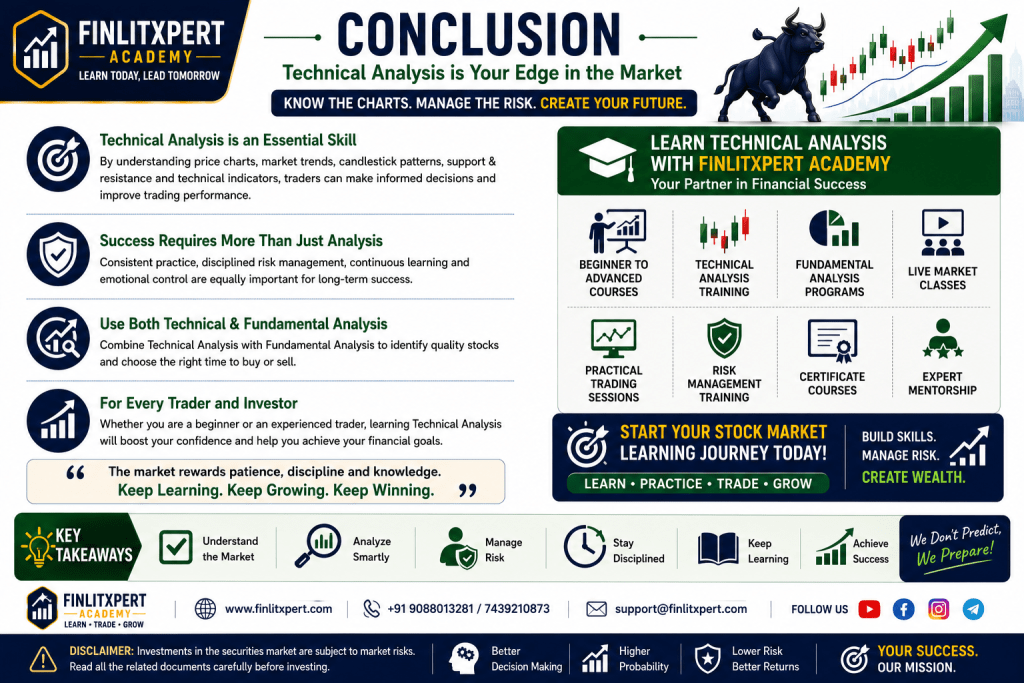
Technical Analysis is an essential skill for anyone interested in stock market trading. By understanding price charts, market trends, candlestick patterns, support and resistance, and technical indicators, traders can make more informed trading decisions and improve their overall performance.
However, Technical Analysis is not a guarantee of success. Consistent practice, disciplined risk management, continuous learning, and emotional control are equally important for becoming a successful trader.
For the best results, combine Technical Analysis with Fundamental Analysis to identify quality stocks and choose the right time to buy or sell.
Whether you are a beginner or an experienced trader, investing time in learning Technical Analysis can significantly improve your confidence and decision-making in the financial markets.
Master Technical Analysis through continuous learning, discipline and practical market experience with FINLITXPERT Academy.